
Optimizing pipeline performance#
This guide explains how to set and verify the performance goal for your data input pipeline to maximize accelerator utilization.
The goal: overlap data loading and computation#
The primary performance goal is simple: data loading on the CPU must be faster than computation on the accelerator (TPU/GPU).
Ideally, while the accelerator is busy with the current step’s computation (e.g., Matmul), the CPU is already prefetching data for the future step(s). This overlap, shown in the following image, ensures the accelerator never has to wait for data.
If data loading is faster than computation, the pipeline is not a bottleneck. Optimizing it further will not improve training speed.
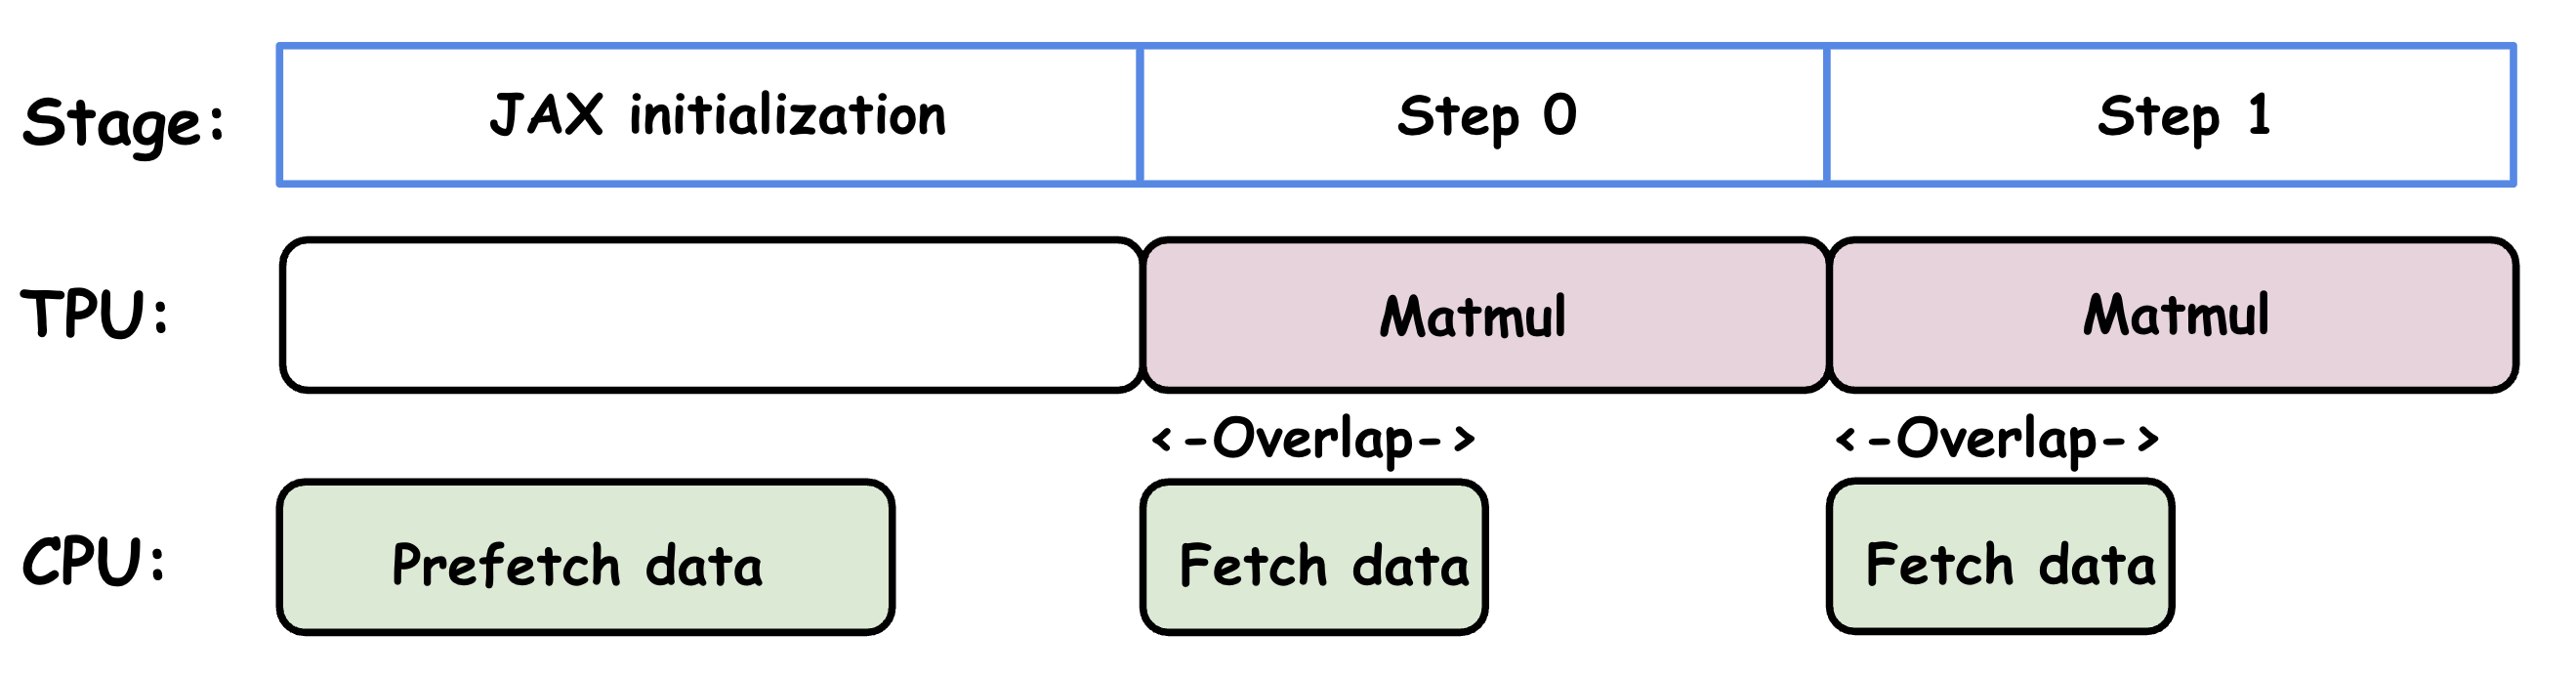
Status of TPU and CPU during training stages.#
Prerequisite: asynchronous execution#
For this overlap to happen, the data pipeline (on the CPU) and the model computation (on the accelerator) must execute in parallel. You can verify this using a profiler.
Good (parallel): The trace on the right shows the CPU (bottom tracks) is busy fetching data at the same time the TPU (top track) is computing.
Bad (sequential): The trace on the left shows a gap in TPU utilization, where the TPU is idle. This gap is often caused by forcing synchronization (as explained in the following section), not necessarily a slow pipeline. While speeding up data loading might narrow this gap, only removing the synchronization eliminates the gap and achieves true parallelism.
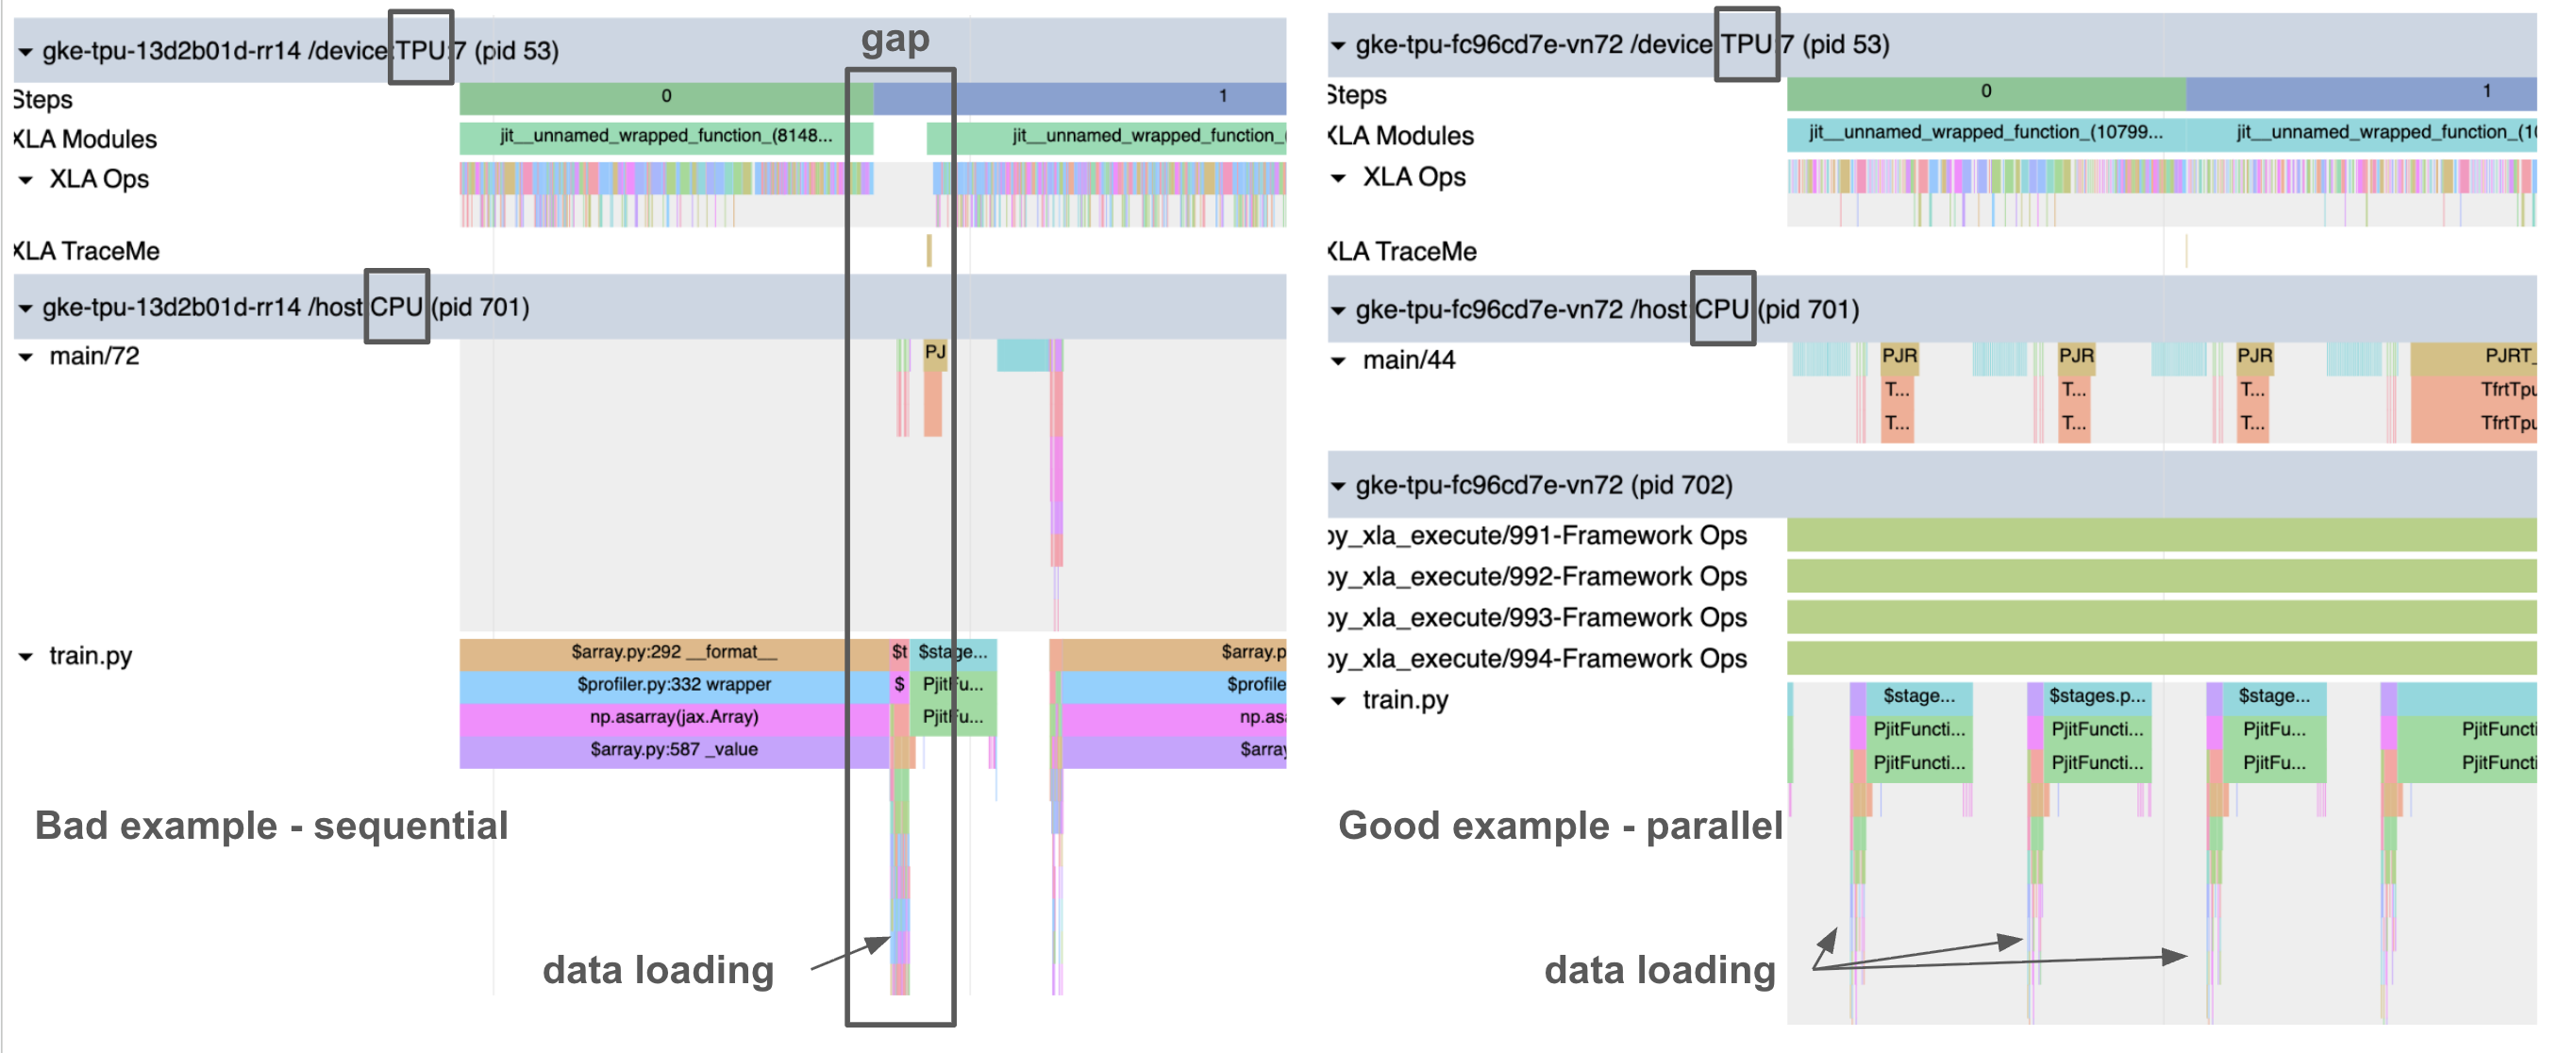
Example profiles of sequential (left) vs. parallel (right) data loading with TPU computation.#
Common pitfall: forcing synchronization#
JAX’s asynchronous dispatch allows the CPU to run ahead. However, this parallelism breaks if your host code (Python) tries to access the result of a computation before it’s finished.
Example: Calling
print(loss)or.block_until_ready()on a JAX array from the current step forces the host to wait for the accelerator, stalling the data pipeline.MaxText solution: MaxText avoids this by using a metrics cache. It only prints the loss from the previous step, allowing the current step’s computation and the next step’s data loading to proceed in parallel (see buffer_and_write_train_metrics() in
metric_logger.py).
How to test your pipeline#
You can check if your data pipeline meets the performance goal in two ways:
Check the profile: Look for gaps in the accelerator trace (like the “Bad” example above). If there are no gaps, your data loading is likely fast enough.
Run in isolation: You can benchmark training and dataloading separately with the following steps: run your training workload with synthetic data (
dataset_type=synthetic) to get a target_step_time time; use a script (likestandalone_dataloader.py) to time how long it takes to load data batches without training. If your data_loading_time is consistently less than your target_step_time, your data pipeline is not the bottleneck. However, if your step time with real data is still slower than your target_step_time, it strongly suggests a forced synchronization issue.
How to speed up a slow data pipeline#
If your profile confirms that data loading is parallel but still slower than computation, then data loading is the bottleneck. Here are a few ways to speed it up:
Tune Grain: If you are using the Grain data pipeline, start by tuning the
grain_worker_count. If adjusting the worker count isn’t enough, use the Grain performance and debugging tool to find the specific bottleneck.Pre-process offline: Perform as much data preparation as possible offline. Apply only light-weight preprocessing during training.